Published March 2023
Viva Connections – the ‘no-brainer’ of the Viva Suite. Why? I call Connections the ‘no-brainer’ of the Viva suite because it’s included in your license anyway, so why wouldn’t you use it?
If you’ve been living under a rock, and don’t know what Viva Connections is, let me break it down at three very basic levels:
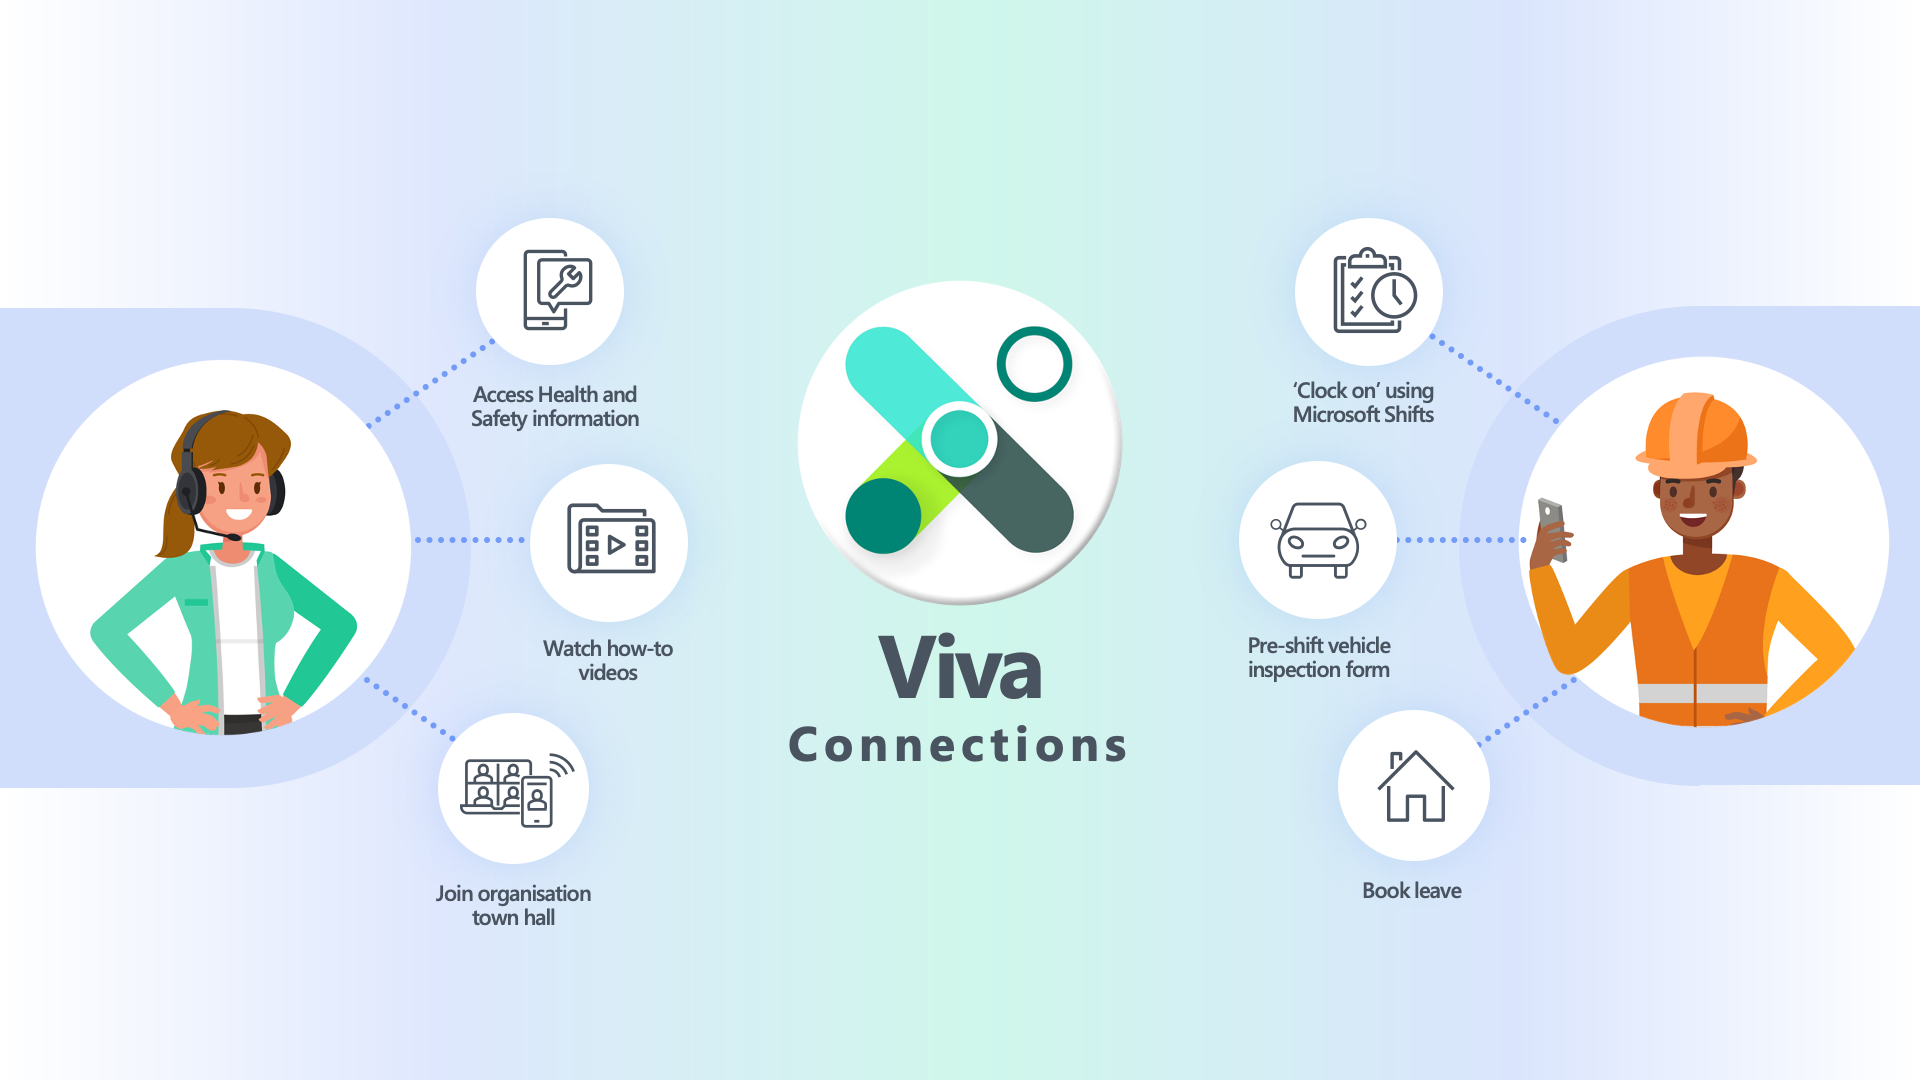
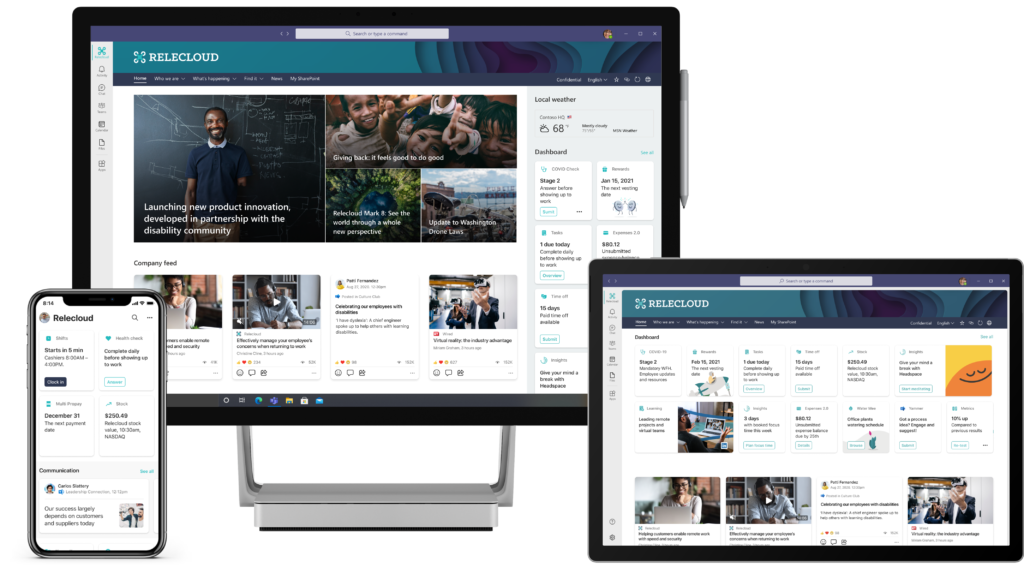
- Desktop: Viva Connections is your SharePoint Online modern intranet presented in Teams with the addition of the Dashboard. The Dashboard is configurable, audience targetable ‘cards’ that facilitate the user undertaking an action. This action could be as simple of loading a hyperlink, right through to complex interactions with 3rd party systems (e.g. applying for leave from the intranet, where the application is actually undertaken in your 3rd party leave application).
- Mobile: Viva Connections presents the Dashboard plus a feed tab which is an aggregated news feed from SharePoint News and Viva Engage and features resources which links off to content.
With Viva recently celebrating its second birthday, I’m here to share what success should look like for Viva Connections and how best to judge the ‘outcome’ of your implementation. Spoiler… it’s all about the end users and impact…
What does Dashboard success look like?
Our role in digital workplace technology, is to give our users the tools they need to do their job and then get out of their way so they can get on with the job and be awesome. In a dream world, the user wouldn’t need to know what tool or system to use, they wouldn’t need 25 different accounts and passwords because everything they needed would be in a single, easy to use place that was personalised to them. In this way the friction we often hear users complain about would be removed.
I’m not sure we’re quite at the nirvana yet, but the Viva Connections Dashboard is step toward that dream.
Reducing the digital workplace complexity
A successful implementation of the Dashboard should aim to connect the disparate ‘dots’ (aka all the apps/systems) in your digital workplace. Most organisations find that by removing complexity from the DWP, and simplifying the user journey the resistance to use provided tools is reduced. Furthermore, the simplified journey encourages users to use the ‘approved’ tech, reducing instances of shadow, unmanaged solutions.
Improving productivity
When I’m working with clients on their Dashboard implementation, we start with identifying the audiences across their employee base, and then identifying and prioritising the ‘top tasks’ for each of those audiences. Some organisations go so far as to measure how long it takes their people to perform those ‘top tasks’ in the current environment, and then measure how long it takes the same users to perform the same tasks in using the Viva Connections Dashboard solution. I really like this approach to proving impact as numbers don’t lie and often these numbers paint a really great story for exec.
Driving usage
A neat implementation that most organisations I work with choose to undertake is using the Dashboard to surface other components of the Viva Suite. Some great examples of this include:
- A headspace card to promote wellbeing
- A Viva Learning card that surfaces the learning that has been assigned to you making it easy to bring learning into the flow of work
- A Viva Topics card that surface this months most popular topic, or a promoted topic ensuring knowledge sharing across the organisation is always top of mind
These cards aim to enhance the value of the Viva Suite by adding to that ‘single pane of glass’ intention – bringing all the suite into the one place, in Teams. Organisations that implement these types of Viva cards see greater usage of the featured components.
Sentiment
Productivity improvements can be measured in a myriad of ways, although it is most often easier to quantify in employee pulse surveys.
A significant percentage of the clients I work with see improvements in sentiment scores around technology in the employee pulse/voice surveys. Here are some ways to measure sentiment toward IT in your next survey:
Question: To what extent do you agree or disagree with this statement? “The digital technology that my organisation supplies me with allows me to efficiently accomplish my work tasks.”
This question allows you to measure the IT alignment and attitude of users toward the provided technology. Comparing this number before and after a Viva Connections implementation typically results in an uplift in users who agree with the statement.
Question: On a scale of 1 to 10, 10 being extremely likely: “Imagine that a friend is interviewing at your company, and you know that working with modern technology and an engaged IT staff is important to them. How likely would you be to recommend they work there?”
This gives you’re your ‘IT Net promoter score’ – if a user is likely to recommend working at your organisation to someone for whom technology is important, their likely to be comfortable with or proud of the technology solutions your organisation provides. Comparing this number before and after a Viva Connections implementation typically results in the demonstration of a positive impact.
Frontline and mobile worker impact
Access to tools/information
Because the mobile presentation of Viva Connections prioritises the Dashboard, Feed and Resources, frontline and mobile workers are given an easy way to do their top tasks. We often see that for these audiences, Dashboard cards like Shifts, Leave, and Payslips are prioritised to make it easier for these audiences to do these tasks without needing to remember usernames/password, log in or even think about what the system behind it is.
We also see a lot users in this audience report that it is easier using Viva Connections to find the policies, SOPs and forms that they would otherwise not be able to access when out and about.
Finally, some organisations are building FLW or mobile worker specific Power Apps, and integrating these with Dashboard cards (which they are designed to do), making life easier for these audiences (read more about our success with Yarra Valley Water here).
Connection to organisation, culture and values
Often we find that mobile workers report feeling disconnected from their organisation. We know that a significant number of people hand pick the organisations they chose to work for based on values and culture. Viva Connections can help maintain this connection by putting the culture of the organisation in the palm of their hand. Features like the feed gives them organisation news and conversations with like-minded colleagues or communities of practice through Viva Engage which ensures they feel part of a community.
Measuring success
On measuring success, different features can, and sometimes should, be assessed against feature specific metrics. For example:
Feature specific
An organisation has Viva Engage, but are finding that there are some teams in the organisation (largely mobile workers) that are using shadow IT (by using external chat apps). An investigation finds that these rogue groups report that it is easier to use the shadow IT as they don’t have to log in, and they only see the conversations they are part of. After implementing Viva Connections, with a supporting adoption and training campaign, usage of shadow IT drops significantly.
Card specific
An organisation is using Viva Learning and recommending courses. After implementing Viva Connections, and a custom card surfacing the number of courses recommended the user, an increase in completed recommended courses is observed.
Card specific
Managers at an organisation are reporting that they find it difficult to stay on top of approvals, leading to delays in work progress. After implementing Viva Connections, custom card to surface approvals, managers are reporting greater visibility of things they need to approve and the analytics show the time form request to approval decreases.
What’s getting the way?
I see and talk to a lot of organisations who have the fear of rolling out Viva Connections if it isn’t perfect for everyone, in every audience. This fear often stems from the belief that they ‘only have one chance to get this right’. Ultimately this leads to teams getting bogged down in over-thinking it. They spend too much time in research and analysis, planning and discussing, that by the time we get to implementation, the game has changed, and no users saw any benefit. The worst case scenario here is that delays to progress mean stakeholders withdraw their support or the project gets cancelled due to lack of progress.
I have so much to say about this, but briefly – the perception that you only get one chance is only true if your organisation plans on rolling our Viva Connections and then calling the job done. Project teams and organisations need to take a product mind set with a view to continual incremental change and improvements. Couple this with sustained adoption campaigns and you’re setting your implementation up for longevity, ongoing measurable impact and project success.
What’s missing?
What’s currently missing is easy, multiple connections per tenant. So many of my clients, especially the larger clients, are desperate to be able to publish more than one Viva Connections app. This is required for organisations on a shared tenant, or global organisations whose local intranet is on the global tenant etc.
But fear not, this is on the Microsoft roadmap (expected June 2023) – thank goodness!
About the author
Rachel Harnott leads the digital workplace and employee experience practice at Engage Squared. Rachel has worked with SharePoint for over 16 years, and comes from a front end developer and UX design background. She is a certified Change Practitioner, UX designer, a mum of 2 boys and a professional singer.